Dashboard Overview
Understanding your personalised dashboard, stats, and activity feed.
Your dashboard is the first thing you see after signing in to CrownSync Playbooks. It provides a personalised overview of your organisation's incident response readiness, recent activity, and quick access to the features you use most frequently.
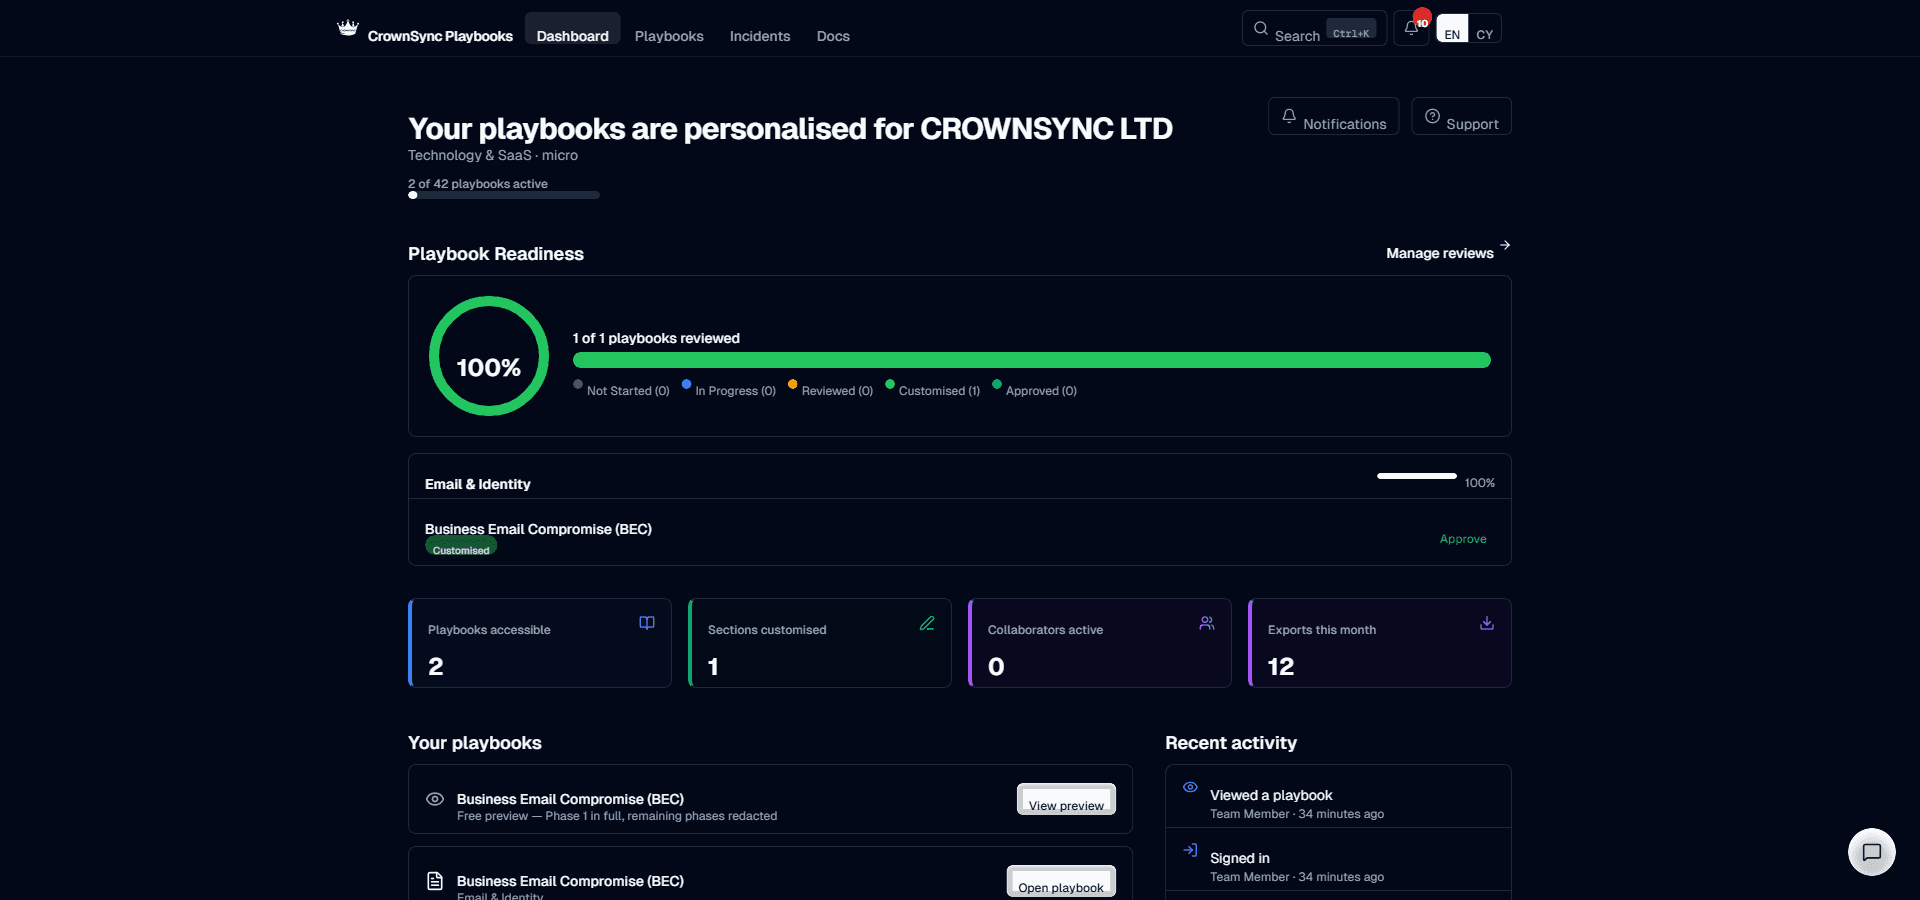
Stats Cards
At the top of the dashboard, four summary cards give you an at-a-glance view of your organisation's current position:
| Stat Card | What It Shows |
|---|---|
| Playbooks Accessible | Number of playbooks your organisation has access to |
| Sections Customised | Number of sections your team has edited |
| Collaborators Active | External contributors currently with access |
| Exports This Month | PDF exports generated in the current month |
Regulatory Badges
Below the stats cards, you will see a row of regulatory badges reflecting the compliance frameworks relevant to your organisation. These are determined by the regulatory flags you set during onboarding or in your organisation settings. Common badges include:
- UK GDPR — Applicable to all organisations processing personal data of UK residents.
- NIS2 — For operators of essential services and digital service providers.
- FCA — Financial Conduct Authority regulated firms.
- PCI DSS — Organisations handling payment card data.
- DSPT — NHS Data Security and Protection Toolkit for health and social care.
These badges determine which conditional sections appear in your playbooks. For instance, an FCA-regulated firm will see additional sections covering FCA notification procedures that a non-regulated organisation would not.
Tech Stack Display
The tech stack panel shows the technologies you selected during onboarding — your email platform, cloud provider, endpoint protection, identity provider, and backup solution. This information drives the conditional logic in your playbooks, ensuring that instructions reference the specific tools your team actually uses rather than generic guidance.
Keep your tech stack current
If you change any part of your technology stack, update it in your organisation settings immediately. Playbook content will automatically adjust to reflect the new tooling, but only after the profile is updated.
Activity Feed
The activity feed occupies the central portion of the dashboard and shows a chronological list of recent actions taken across your organisation's account. Each entry includes the action type, the user who performed it, and a timestamp. Typical entries include:
- Playbook sections edited or published
- New collaborators invited or access revoked
- PDF exports generated
- Incidents declared or closed
- Drill exercises started or completed
- Team members added or removed
The feed shows the 20 most recent actions. For a complete history, visit the audit log in the admin section.
Service Desk Status
If your organisation has configured a service desk integration (such as ServiceNow, Jira Service Management, or Freshservice), a status indicator appears on the dashboard showing the connection health. A green indicator means the integration is active and synchronising correctly. An amber indicator suggests a configuration issue that may need attention. See the integrations section for setup instructions.
Quick Actions
The quick actions panel provides one-click access to the most common tasks:
- Declare Incident — Opens the incident declaration form immediately.
- Start Drill — Launches the drill setup wizard.
- Browse Playbooks — Takes you to the full playbook catalogue.
- Export All PDFs — Initiates a batch export of all active playbooks (admin only).
- Invite Team Member — Opens the team invitation dialog (admin only).
These actions adapt based on your role. Members will not see admin-only actions such as batch export or team invitations.
Was this page helpful?